MadiCare
With my previous experience with Raspberry Pi, I would like to continue to explore the capability of the single-board machine to understand the concept of the Internet of Things (IoT) and apply the technology to the medical field.
Due to the pandemic, our health system is under lots of stress. Health professionals were unable to monitor the health status of the immense number of patients. That lack has led to inadequate treatments and loss of lives. An inexpensive tool like Raspberry Pi can benefit patients in monitoring their health and reduce the workload of healthcare professionals.
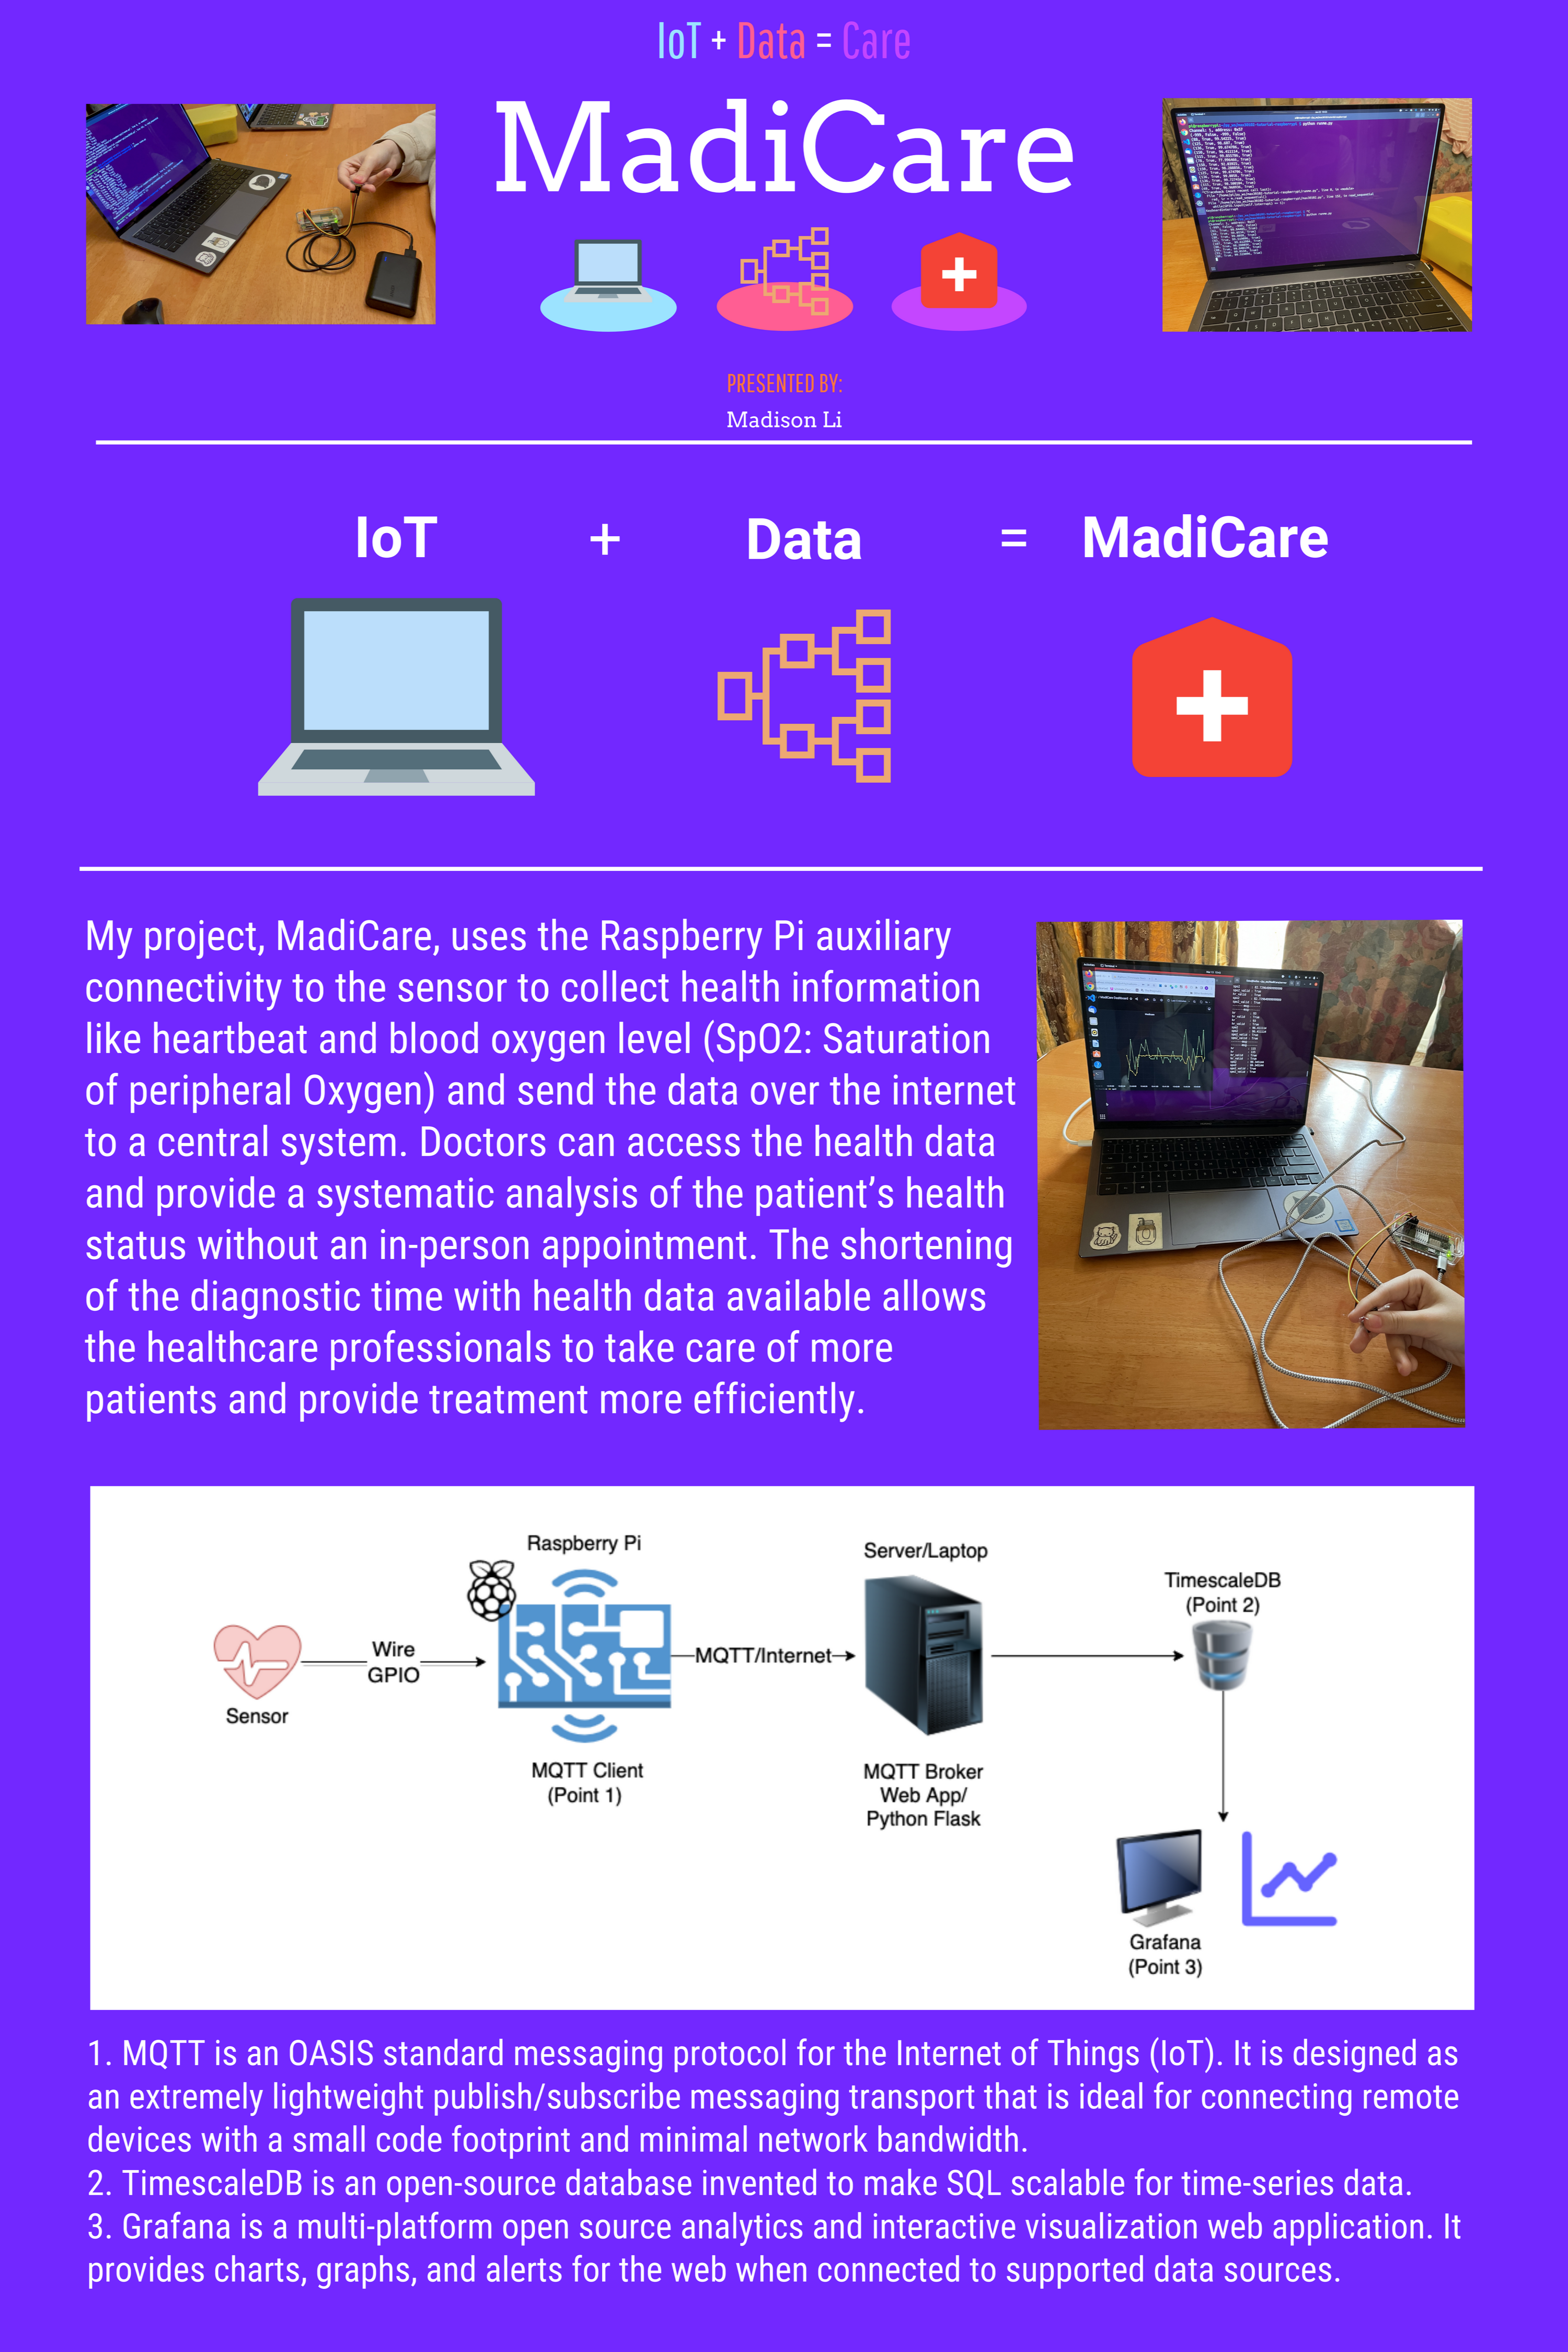
My project, MadiCare, uses the Raspberry Pi auxiliary connectivity to the sensor to collect health information like heartbeat and blood oxygen level (SpO2: Saturation of peripheral Oxygen) and send the data over the internet to a central system. Doctors can access the health data and provide a systematic analysis of the patient’s health status without an in-person appointment. The shortening of the diagnostic time with health data available allows the healthcare professionals to take care of more patients and provide treatment more efficiently.
Steps:
- Tested the basic data collection with the sensor on the Raspberry Pi.
- Put finger on the sensor and the Pi will collect data of heart beat and blood oxygen level and show the data on computer (e.g. 88 heart rate, 99 SpO2)
- With the data collecting function, I configured the Pi to send data to the server, my computer, using MQTT protocol.
- MQTT is an OASIS standard messaging protocol for the Internet of Things (IoT). It is designed as an extremely lightweight publish/subscribe messaging transport that is ideal for connecting remote devices with a small code footprint and minimal network bandwidth.
- Created a server program to store data into the database (TimescaleDB)
- TimescaleDB is an open-source database invented to make SQL scalable for time-series data.
- Present data from the database using Grafana.
- Grafana is a multi-platform open source analytics and interactive visualization web application. It provides charts, graphs, and alerts for the web when connected to supported data sources.